What is Standard Deviation How to calculate standard deviation in excel?

Standard deviation, which has an important place in statistics, is a very important criterion for understanding the data and directing the projects. The term standard deviation, which allows us to interpret the general situation and variability of the values in the data, is encountered in many parts of life. It is important for everyone to learn how to calculate the standard deviation because it plays an active role in life and projects. What are we waiting for? Let's start.
1. What is Standard Deviation?
2. How to Find Standard Deviation, What is Standard Deviation Formula?
3. What is Population in Statistics, How to Find Population Standard Deviation?
4. What is Sample in Statistics, How to Find Sample Standard Deviation
5. How to Calculate Standard Deviation in Excel?
6. What are Excel Formulas Used to Calculate Standard Deviation in Excel?
7. What is Excel STDEV.P Formula?
8. What is Excel STDEVPA Formula?
9. What is Excel STDEV.S Formula?
10. What is Excel STDEVA Formula?
11. Standard Deviation Calculation Example in Excel
What is Standard Deviation?
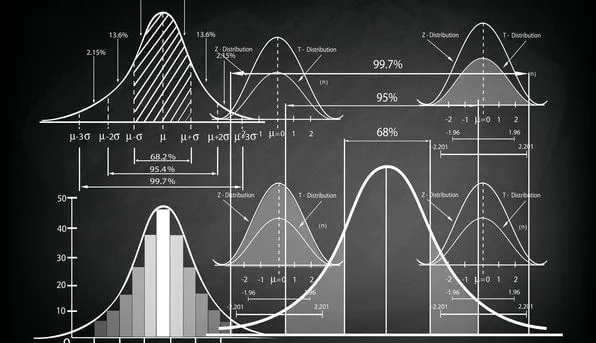
Standard deviation is a statistical term that indicates how much the values in a data set deviate from the mean. We can make inferences about the distribution, homogeneity and regularity of the data by calculating the standard deviation. The symbol for standard deviation, which has a great use in data analysis and statistics, is σ (sigma).
How to Find Standard Deviation, What is Standard Deviation Formula?
The first step to calculate the standard deviation is to calculate the difference of each value in the dataset with the arithmetic mean. In the second stage, the squares of these differences are calculated and these squares are summed. We continue the process by dividing this value obtained by the number of data when calculating the population standard deviation and by one minus the number of data (N-1) when calculating the sample standard deviation. Finally, the standard deviation is calculated by taking the square root of the obtained value. So what is population, what is sample? Let's briefly examine these terms and get rid of all the question marks in our minds.
What is Population in Statistics, How to Find Population Standard Deviation?
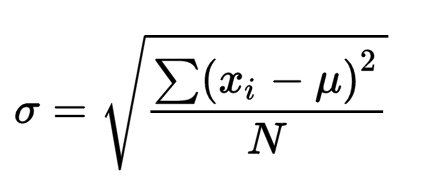
Population is a statistical term that refers to all data in the relevant study. For example, if a study is conducted on high school students in Turkey and we have data on all high school students in Turkey, we are working with population data. The following formula is used to calculate the standard deviation of the population.
What is Sample in Statistics, How to Find Sample Standard Deviation?
Sample is a statistical term that refers to a certain part of the data in the relevant study. A smaller data set selected from the data is called a sample. Let us examine the same example again. Suppose a study is conducted on high school students in Turkey. This time, let's have the information of 10 thousand of all high school students. Since we have a set of this data instead of the whole data, it means that we are working with sample data. The following formula is used to calculate the standard deviation of the sample.
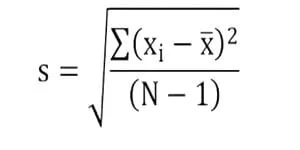
The only difference to be considered when calculating the standard deviation for the population and the sample is the value in the denominator. The only difference in the standard deviation of the population and the sample is the denominator. Of course, we will not apply these operations one by one to calculate the standard deviation. Why is there excel if we are going to calculate it one by one! Let's examine how to calculate standard deviation in excel and make our job easier!
How to Calculate Standard Deviation in Excel?
Excel is a pioneering programme that has an important place in analysis processes. For this reason, how to calculate the standard deviation in Excel is an important issue for many analysts and projects. There are 4 formulas that we can use when calculating standard deviation in Excel. Let's examine the standard deviation calculation formulas together.
What are Excel Formulas Used to Calculate Standard Deviation in Excel?
The excel formulas used to calculate standard deviation in excel are STDEV.P, STDEVPA, STDEV.S, STDEVA. If these similar excel formulas did not make sense to you, there is no need to be afraid. Let's examine these formulas respectively.
What is Excel STDEV.P Formula?
STDEV.P formula is an excel formula used to calculate the standard deviation of values in the population. If there are non-numeric values among the values used to calculate the standard deviation of the values written in the formula, the STDEV.P excel formula will not include these values in the calculation. In other words, this formula only works with numeric values. To calculate the standard deviation, it will be enough to write the values into the formula or select a range.
=STDEV.P(number1; number2; number3; .......)
What is Excel STDEVPA Formula?
STDEVPA formula is another excel formula used to calculate the standard deviation of the population. The difference of this formula from the STDEV.P formula is that it can operate with different types of data when calculating the standard deviation. If our data is not only numeric and there are different types of values, we can calculate the standard deviation using the STDEVPA formula. STDEVPA excel formula is an important excel formula that allows us to calculate the standard deviation of different types of values. To use this formula, it will be enough to write the values in the formula or select a range.
=STDEVPA(number1; number2; number3; .......)
What is Excel STDEV.S Formula?
The STDEV.S formula is an excel formula used to calculate the standard deviation of the sample. STDEV.S excel formula, like STDEV.P formula, only considers numeric values and ignores different types of data when calculating standard deviation. To use this formula, it will be enough to write the values in the formula or select a range.
=STDEV.S(number1; number2; number3; .......)
What is Excel STDEVA Formula?
STDEVA formula is another excel formula used to calculate the standard deviation of the population. The difference of the STDEVA excel formula formula from the STDEV.S formula is that it can operate with different types of data when calculating standard deviation. If there are different types of values in the data, we can calculate the standard deviation of the sample using the STDEVA formula. STDEVA excel formula is an important excel formula that allows us to calculate the standard deviation of different types of values. To use this formula, it will be enough to write the values in the formula or select a range.
=STDEVPA(number1; number2; number3; .......)
Standard Deviation Calculation Example in Excel
Let's make an example from daily life using one of these formulas and calculate the standard deviation. Let's calculate the standard deviation of the population numbers of countries and evaluate the result together.
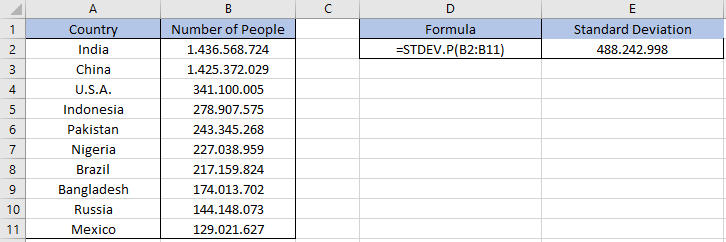
As seen above, the standard deviation was calculated as approximately 488 million. When the values in the data are analysed, we can say that this standard deviation is a large value. This standard deviation tells us that the values are far from the average and the deviation amounts are high.
Now we know the answer to the questions of what is standard deviation and how to calculate standard deviation in excel. When evaluating the data, we can create more meaningful projects by calculating and evaluating the standard deviation and of course we can save time by doing these operations in excel.
1. How to use Python in Excel?
2. What is the Excel VLOOUP formula and how to use it?
3. How to make a dropdown menu in Excel?
4. What are the most important Excel formulas for data analysis?
5. What is Excel IFS Formula, How to Use IFS formula?
If you want to be informed about the developments and case studies about statistics, excel and excel formulas, you can follow me from the accounts below.
Linkedin: www.linkedin.com/in/mustafabayhan/
Medium: medium.com/@bayhanmustafa


