

Data Science
Correlation: Correlation Coefficient | Causal vs Correlation
Correlation is an important criterion for us to understand the status of variables relative to each other. Correlation analysis, which is used in many places from products in the supermarket shelves to investment instruments, is in many parts of our lives. Although we do not realise it, understanding this approach, which affects our decisions in many areas, will give us an advantage in every aspect. What are we waiting for? Let's start!
Content
1. What is Correlation
2. Correlation Coefficient Calculator
3. Correlation Coefficient Formula
4. Correlation Analysis: How to Do Correlation Analysis?
5. Pearson Coefficient Calculator with Excel
6. Causal vs Correlation
1. What is Correlation
2. Correlation Coefficient Calculator
3. Correlation Coefficient Formula
4. Correlation Analysis: How to Do Correlation Analysis?
5. Pearson Coefficient Calculator with Excel
6. Causal vs Correlation
What is Correlation?
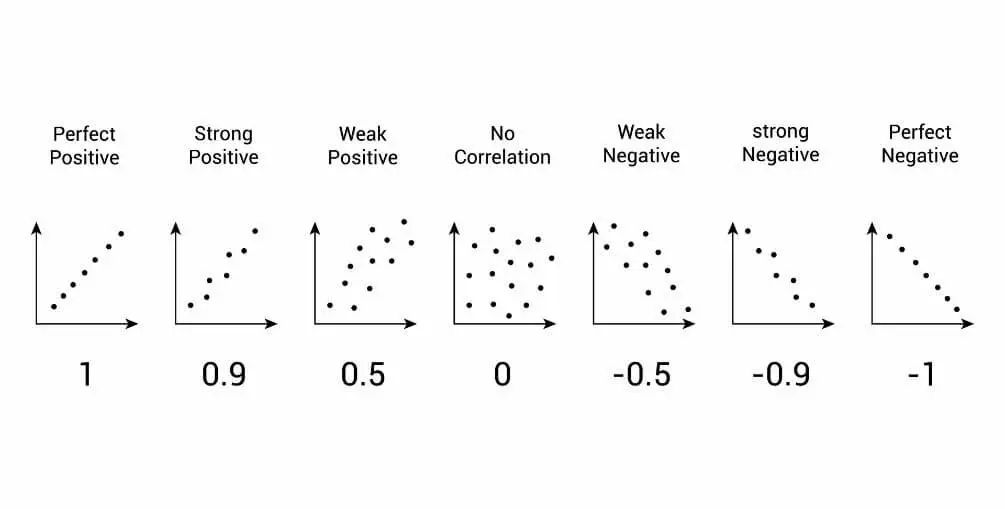
Correlation is a statistical term that represents the strength and direction of the relationship between two variables. With the correlation value, the direction and magnitude of the relationship between two variables can be analysed. Correlation can take a value between -1 and 1. If the variables have a positive relationship and increase and decrease together, the correlation value is positive. The closer the correlation coefficient is to 1, the greater the relationship between the variables. If the variables move in the opposite direction and when one variable increases, the other decreases, the correlation value is negative. As the correlation coefficient approaches -1, the inverse relationship between the variables increases. To summarise, if the correlation coefficient is positive, there is a same directional relationship; if it is negative, there is an inverse relationship. You can examine the graphical representation of correlation in the picture below.
Correlation Coefficient Calculator
Many formulas have been developed to calculate the correlation coefficient. Pearson Correlation Coefficient, Spearman Rank Correlation Coefficient, Kendall Tau Correlation Coefficient and Point-Biserial Correlation Coefficient formulas can be preferred to calculate correlation. The most commonly used of these formulas is the Pearson Correlation Coefficient formula.
Correlation Coefficient Formula
Pearson correlation formula can be used to calculate correlation. We can easily (!) calculate the correlation using the formula below.
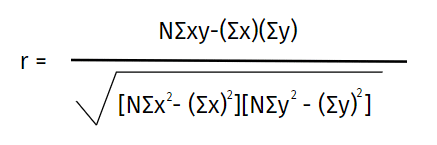
I realise that you are getting away from the subject. We will not need to use this easy formula that uses averages and products of variables. We can do this in seconds with applications such as Excel, SPSS, Python. How? The rest of the article is waiting for you :)
Correlation Analysis: How to Do Correlation Analysis?
In order to perform correlation analysis, we must first have the data of the variables. We can calculate the correlation coefficient using the correlation formula on these data. Of course, this is a long and tiring process. For this reason, choosing programmes such as SPSS, Python, Excel to calculate correlation will make our job easier.
Pearson Coefficient Calculator with Excel
One of the most used programmes today is of course excel. Let's examine how to calculate correlation in excel.
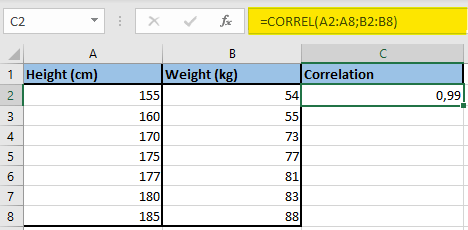
The CORREL excel formula is used to calculate correlation in Excel. This excel formula can be easily adapted to our work in the "=CORREL(data1; data2)" structure. The formula calculates the correlation value of the data written into it.
The following example shows the relationship between height and weight. In the data used, as the height increases, the weight value also increases. This positive relationship is also calculated by the correlation value, which is very close to 1.
If you want to learn more excel formulas for data analysis, you can review my article Excel Formulas for Data Analysis.
How to Interpret Correlation Analysis in Statistics?
As a result of correlation analysis, the direction of the relationship between the data and the strength of the relationship can be easily understood. So what exactly does this do? For example, as a result of correlation analysis, related products are placed close to each other in the shelves. Related products are often preferred in discount campaigns. In the fields of finance and investment, investment instruments are examined by correlation analysis and portfolios are arranged according to this analysis. Correlation analysis, which seems very simple, is actually used in many parts of our lives.
Correlation Analysis: Causal vs Correlation
The most important point to be considered in correlation analysis is that correlation may not be a cause and effect relationship. The fact that two variables move together does not mean that they affect each other. A third variable may cause two variables to move together. For example, there is a strong positive correlation between ice cream sales and sunbed sales. The reason for this correlation is another variable, air temperature.
If you want to read similar content about statistics, you can also review my articles below.
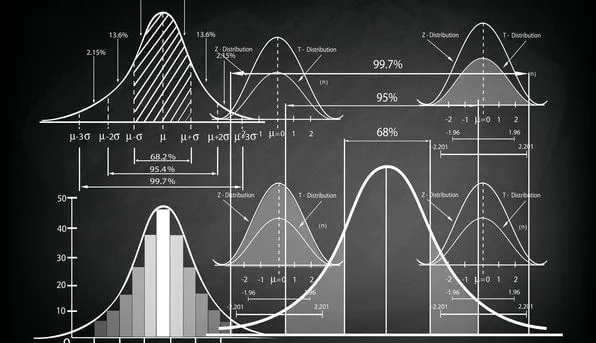
1. What is Standard Deviation
2. What is ChatGPT?
3. What is Recommendation System
4. Best Resources to Learn Data Science
1. What is Standard Deviation
2. What is ChatGPT?
3. What is Recommendation System
4. Best Resources to Learn Data Science
If you want to be informed about the developments and case studies about statistics, excel and excel formulas, you can follow me from the accounts below.
Linkedin: www.linkedin.com/in/mustafabayhan/
Medium: medium.com/@bayhanmustafa
Tags Related to Correlation and Statistics
Correlation | Pearson Correlation Coefficient | Correlation Calculator
About author

Mustafa Bayhan
Hi, I'm Mustafa Bayhan. I am an Industrial engineer who works in data-related fields such as data analysis, data visualization, reporting and financial analysis. I am working on the analysis and management of data. My dominance over data allows me to develop projects in different sectors. I like to constantly improve myself and share what I have learned. It always makes me happy to meet new ideas and put these ideas into practice. You can visit my about me page for detailed information about me.
You may also like


0 Comments
Leave a Reply
Recent Posts

Kumru AI İncelemesi: Güçlü Yönleri, Zayıf Yönleri ve Kullanım Deneyimi
Large Language Models (LLMs): RAG, Context Engineering, and AI Agents

Model Selection in Data Analysis: What are AIC and BIC?

Types and Meanings of Histograms Used in Data Analysis

Can Correlation Be Used to Infer Causality?
Histogram Nedir, Histogram Grafiği Nasıl Yapılır?