


Excel
Python Is Coming to Excel! How to use Python Excel?
Microsoft is preparing to integrate the python programming language, the powerful name of data analysis, into Excel. Two strong data analysis programs are coming together in this significant development that will alter the dynamics of the game. So, how do we use Python in Excel? What can we do in Excel with Python? Most importantly, will this effort to bring Excel back to its former glory days be a success? Let's examine this great development together.
Why Is It Important that Python Comes to Excel?
Although Excel is a leading program in analysis studies, it has started to be less preferred due to its slow operation in big data. In addition, many operations were required to organize the data at both the analysis and visualization stages. With the integration of Python into Excel, Excel's speed problem will be left behind. Since it is very easy to change and edit data with Python, Excel will have a more dynamic structure. Thanks to these new developments, excel will begin to consolidate its place in analysis studies and return to its former bright days.
With the integration of Python into excel, there will also be a major improvement in the field of data visualization. While making dynamic graphics in Excel required a lot of effort, reports were running very slowly at the same time. Shaping data together with Python will be much easier. With Python's data visualization libraries, data can also be converted into dynamic and impressive graphics.
Another advantage of Python coming to Excel is that data analysis and machine learning techniques can be easily applied to Excel studies. Using machine learning techniques, one of the most popular topics of today, in Excel required a lot of effort. For this reason, Excel was not a very preferred program in this area. With this new development, analysis and machine learning studies in Excel will also become easier.
How to Get Python Excel?
In order to use Python in Excel, we will not need to install Python on the computer. Python codes written in Excel will be run automatically by the Microsoft Cloud (Microsoft Azure) system. At this stage, the only thing we have to do is to write the python code in Excel.
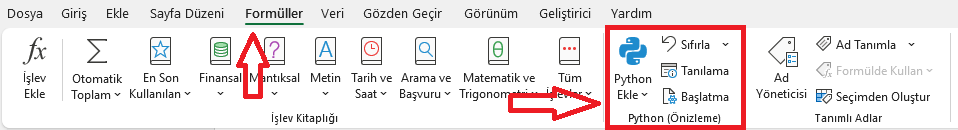
Microsoft is currently testing Python only in the Microsoft Beta version. To use Python in Excel, you must be a member of the Microsoft Beta channel. By following the instructions on Microsoft's page, you can easily access the beta version and have the opportunity to try new updates. You can access the relevant page here. Following the instructions and becoming a member of the beta channel will be enough to use Python in Excel. After these steps, Python will go to the formulas tab in Excel.
How to Enable Python Excel?
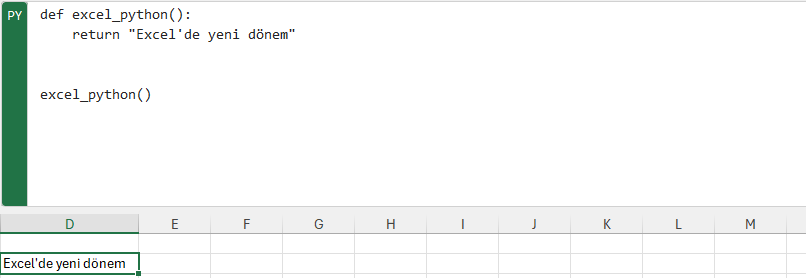
To use Python in Excel, it is sufficient to select an Excel cell and write the expression "=PY(". After opening the parenthesis, Excel will automatically switch to Python mode. After switching to Python mode, a green banner with "PY" written on it will appear on the left of the formula bar. After this stage, we can write the Python code we want in the cell and run it. We can examine how the Python mode looks and works with a simple code.
What is the Shortcut Combination of Python Mode in Excel?
We can also enable Python mode in Excel by using the CTRL + ALT + SHIFT + P combination after clicking on the cell in which you want to write Python code.
How to Run Python Code in Excel?
After writing the Python code, using the CTRL + ENTER combination will be enough to run the code.
What Can Be Done in Excel with Python?
So what can we do in Excel using Python? Excel program can be used easily in many areas where working with Python. The most notable of these areas are:
• Data cleaning and manipulation
• Data visualization
• Data analysis
• Machine learning
With the use of Python, Excel is expected to gain strength in these areas.
Let's examine examples made with Python in Excel!
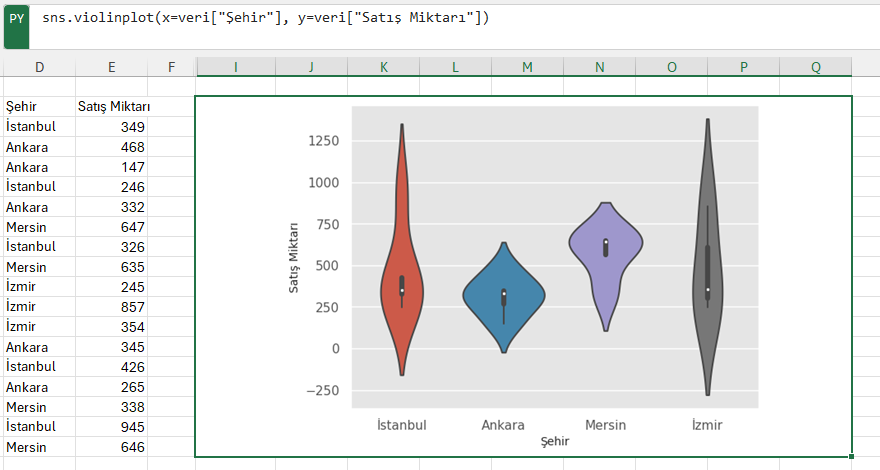
With the integration of Python to Excel, charting and data visualization processes will both improve and become easier. For example, a single line of Python code works to create the beautiful chart below.
We can now easily create the following PACF graph in Excel, which is often used in time series analysis and has a very important place in this field. For detailed information about time series and PACF graph, you can read my article called "What is Time Series Analysis?".

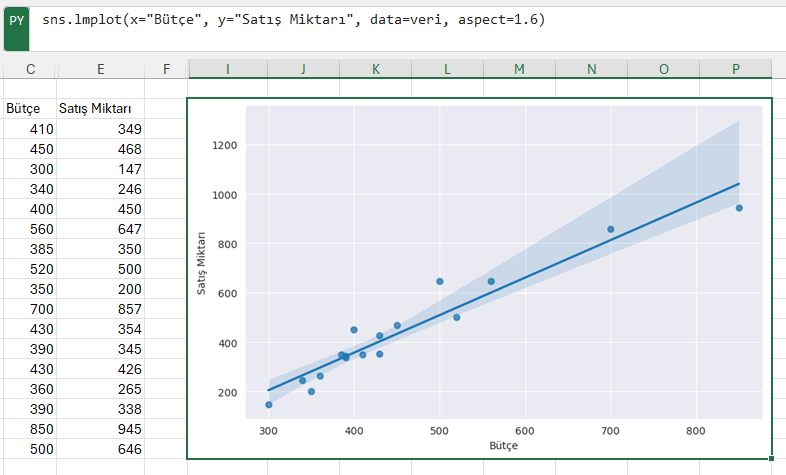
It is now possible to create the graph of linear regression, which we encounter frequently in analysis studies, in Excel with a single line of Python code.
With this magnificent development, Excel will be more preferred in studies carried out in fields such as data cleaning, data analysis and machine learning. It will be much easier to do work in these areas in Excel. As a result, Excel will regain its former power in analysis projects.
If you want to be informed about the developments and case studies about the use of Python in Excel, you can follow me from the accounts below.
Linkedin: www.linkedin.com/in/mustafabayhan/
Medium: medium.com/@bayhanmustafa
Tags about Python Excel
python in excel excel in python python excel learn excel learn python
About author

Mustafa Bayhan
Hi, I'm Mustafa Bayhan. I am an Industrial engineer who works in data-related fields such as data analysis, data visualization, reporting and financial analysis. I am working on the analysis and management of data. My dominance over data allows me to develop projects in different sectors. I like to constantly improve myself and share what I have learned. It always makes me happy to meet new ideas and put these ideas into practice. You can visit my about me page for detailed information about me.
You may also like
1 Comments
Leave a Reply
Recent Posts

Kumru AI İncelemesi: Güçlü Yönleri, Zayıf Yönleri ve Kullanım Deneyimi

Large Language Models (LLMs): RAG, Context Engineering, and AI Agents

Model Selection in Data Analysis: What are AIC and BIC?

Types and Meanings of Histograms Used in Data Analysis

Can Correlation Be Used to Infer Causality?

Histogram Nedir, Histogram Grafiği Nasıl Yapılır?


Zane July 3, 2026, 5:17 p.m.
References: Macau city casino monte carlo las vegas casino