Power Bi | Dashboard in Power Bi | Power Bi Courses

What is Microsoft Power Bi?
Power bi is a business intelligence reporting platform that allows fast editing and visualisation of big data. Launched by Microsoft in 2011, Power bi is one of today's most important business intelligence platforms. Powerbi provides advantages in dynamic reporting of complex data and especially in creating dashboards. Compared to Excel, Power bi can process data faster. In addition, Powerbi, which is easier to use than Excel, provides convenience to users thanks to this feature.
What is Business intelligence (BI)?
Business intelligence (BI) is a set of processes that ensure the regular use of data. Business intelligence studies include data collection, organisation, classification, storage, analysis and reporting processes. The most important business intelligence tools are SAP, Power BI, Oracle, SQL, Tableau tools. One of the most important benefits of Business Intelligence studies is data warehouse (dwh) studies.
What is Data Warehouse (DWH)?
A data warehouse (DWH) is a modern data management system that allows organising, classifying and managing complex data from different sources. Data Warehouse makes it easier for companies to use data, prevents damage caused by unnecessary data and supports analysis processes.
Power Bi Training: Power bi Courses
Microsoft Power Bi Cetification: Ms Power Bi Courses:
Udemy: Power Bi Online Courses:
YouTube: Microsoft Power Bi Courses:
Power Bi Dashboard, Power Bi Dashboard Examples
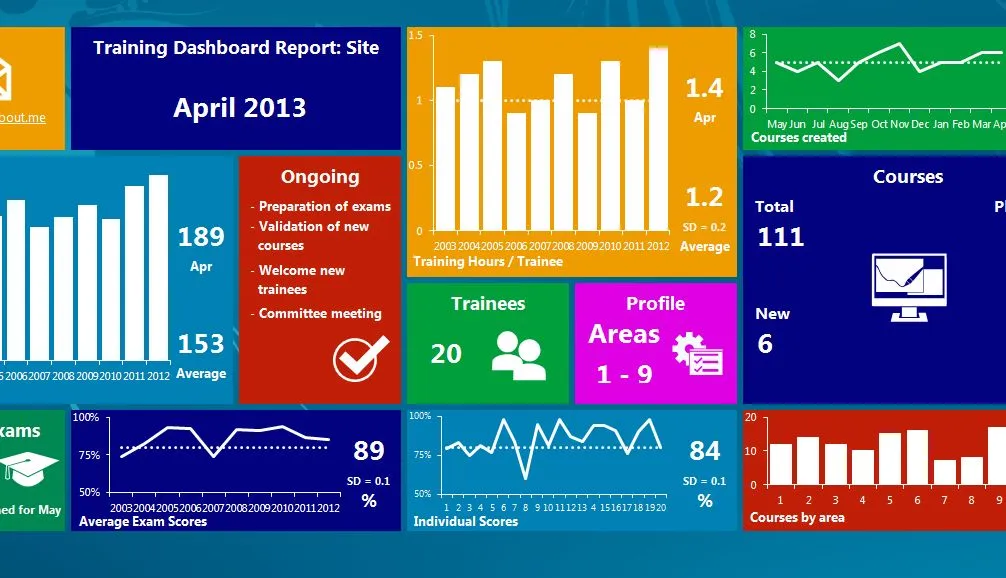
Using Microsoft Power Bi, dashboards can be prepared in every area where data is available and data can be visualised. Especially in business life, the power bi platform plays an important role in visualising many processes. Let's examine the most frequently prepared dashboard examples with the power bi platform.
Power Bı Dashboard Sales Report
Power Bı Dashboard KPI Report
Power Bı Dashboard P&L Report
Power Bı Dashboard HR Report
Power Bı Dashboard Budget Report
Power Bi Download
You can use power bi download link to download Microsoft Power Bi.
How to use Powerbi Online?
You can click online powerbi link to use the Powerbi online.
Microsoft Power Bi ile ilgili yeniliklerden ve örnek çalışmalardan haberdar olmak için beni aşağıdaki hesaplardan takip edebilirsiniz.
Linkedin: www.linkedin.com/in/mustafabayhan/
Medium: medium.com/@bayhanmustafa













ps collaborations Sept. 18, 2024, 12:01 p.m.
Good and helpful blog.